Why Dashboards Are Essential For Large-Scale Video Workflows
Streaming service providers face many challenges in delivering high-quality video content to their audiences. They need to manage complex media processing workflows, monitor hardware resources, troubleshoot errors and issues, and optimize their performance and revenue. That’s why they need software dashboards that provide real-time visualization for large scale media processing workflows.
What are software dashboards for streaming service providers?
Software dashboards are web-based applications that allow streaming service providers to view and control various aspects of their media processing workflows. They can display metrics such as CPU, RAM and network usage, ongoing media processing jobs, pending jobs, failed jobs, non-functional servers, and more. They can also provide alerts and notifications for any problems or anomalies that occur in the system.
Software dashboards can help streaming service providers to:
- Improve efficiency and productivity: By having a clear overview of their media processing workflows, streaming service providers can identify bottlenecks, optimize resource allocation, and streamline their operations.
- Enhance quality and reliability: By monitoring hardware resources and media processing status, streaming service providers can ensure that their video content is delivered with minimal latency, buffering, or glitches.
- Reduce costs and risks: By detecting and resolving errors and issues quickly, streaming service providers can avoid downtime, data loss, customer complaints, and revenue losses.
Why do streaming service providers need customized dashboards?
Streaming service providers have different needs and preferences when it comes to their media processing workflows. They may have different types of video content, formats, platforms, audiences, monetization models, etc. Therefore, they may not be satisfied with the generic or pre-built dashboards that are available in the market. They may need customized dashboards that are tailored to their specific requirements and goals.
Customized dashboards can offer streaming service providers several benefits such as:
- More flexibility and control: By building their own dashboards, streaming service providers can choose the data sources, metrics, visualizations, filters, layouts, etc. that suit their needs. They can also update and modify their dashboards as their needs change over time.
- More relevance and accuracy: By using their own data and logic, streaming service providers can ensure that their dashboards reflect their actual situation and performance. They can also avoid any errors or inconsistencies that may arise from using third-party data or tools.
- More differentiation and innovation: By creating their own dashboards, streaming service providers can showcase their unique value proposition and competitive edge. They can also experiment with new ideas and features that can enhance their user experience and business outcomes.
How can streaming service providers build customized dashboards?
Streaming service providers can use specialized enterprise dashboard software to build customized dashboards for their media processing workflows. These software tools are designed to handle large volumes of data from various sources and provide powerful features for data analysis and visualization.
One example for a customized dashboard for streaming service providers is the Vcodes Dashboard, which provide complete visualization for the vCoder media processing platform.
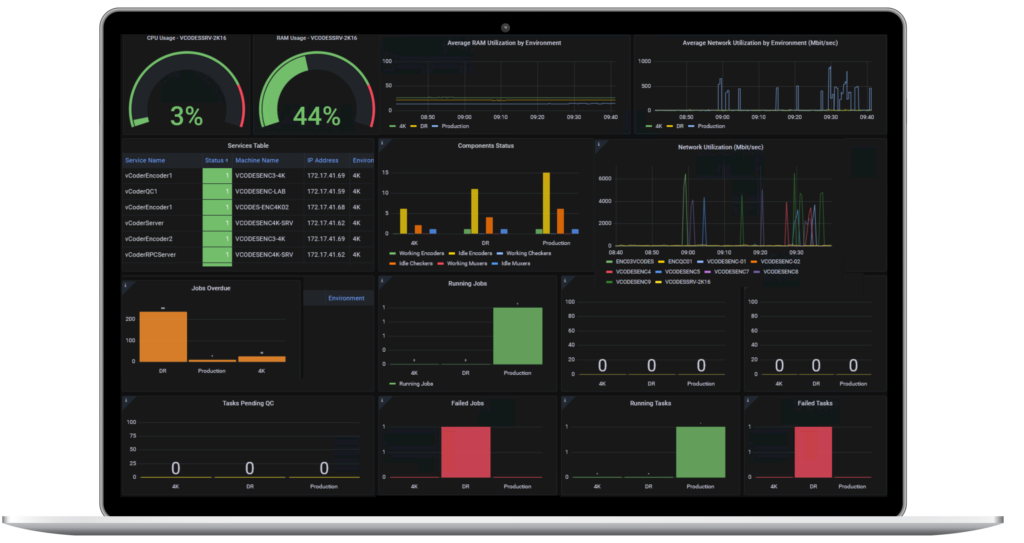
The Vcodes Dashboard enables real-time visualization and monitoring of vCoder workflows and system resources
Some of the popular enterprise dashboard software tools are:
- Grafana: This is an open-source platform for monitoring and observability. It allows users to query, visualize, alert on, and understand metrics from various data sources such as Prometheus, Elasticsearch, InfluxDB, etc.
- Power BI: This is a business intelligence tool from Microsoft that enables users to connect to hundreds of data sources, model and transform data, create interactive reports and dashboards, and share insights across devices.
- Kibana: This is a data visualization tool that works with Elasticsearch to provide real-time analysis of large datasets. It allows users to create charts, tables, maps, timelines, etc. from structured and unstructured data.
These software tools can help streaming service providers to build customized dashboards by following these steps:
- Connect to data sources: The first step is to connect the dashboard software to the data sources that contain the relevant information for the media processing workflows. These data sources may include databases, APIs, files, etc.
- Prepare and model data: The next step is to prepare and model the data for analysis and visualization. This may involve cleaning, transforming, aggregating, calculating, etc. the data according to the desired metrics and dimensions.
- Design and create visualizations: The final step is to design and create the visualizations that will display the data in a clear and compelling way. This may involve choosing the appropriate charts, tables, maps, etc., applying filters, colors, labels, etc., and arranging the layout and style of the dashboard.
Summary
Software dashboards are essential tools for streaming service providers who want to deliver high-quality video content to their audiences. They provide real-time visualization for large scale media processing workflows, which can help them improve efficiency, quality, reliability, costs, and risks. However, streaming service providers may not be satisfied with the generic or pre-built dashboards that are available in the market. They may need customized dashboards that are tailored to their specific needs and goals.
Vcodes specializes in building customized dashboards for its customers, based on proven open-source software like Grafana. Drop us a line here and tell us about your requirements!